Last Wednesday & Today (It’s Thursday when I’m writing this) you’re seeing the market take a pull back from a number of positive sessions, based on some weak Industrial production numbers as well as weaker than expected retail sales numbers. This following some positive data on inflation (meaning the data is showing it slowing).
There’s no nice way to say this so I’ll just say, “Get used to it”. I’ve mentioned previously that I believe this year (particularly first half) will be volatile and will likely continue to trade within a range. This is the battle we will face on improving inflation numbers will mean an economic slowdown, (yes, the R word). This needs to happen or we risk the Fed raising us into a catastrophic situation. I suspect some of the weakness in retail numbers can be attributed to weather through December.

The big movement in the markets is happening in the bond market. Not many reports on this, mainly due to them not understanding it. The yield curve has been coming down since the start of the year. The previous pattern for this has been yields coming down as stocks go up (stocks enjoying the fact inflation is retreating), however yesterday stocks came down and so did yields, substantially in certain durations. This highlights a big disconnect between the Fed, and the bond markets. The Fed saying, they will be staying higher for longer and the markets saying they won’t be able to. Remember the Fed controls the short end of the bond market (Overnight rate) and the market controls the rest.

Treasury.gov
The concern now is the disconnect is affecting stocks, and the fear is the Fed will hold or raise rates causing a really nasty recession. The bond market is not a believer. Check out the next chart. The blue line is the 2-year treasury, and the red is the Fed Funds rate. We don’t see too many occasions where the 2-year doesn’t get it right when predicting what the Fed will have to do.

Source: Bloomberg Charting 2023/Bloomberg Finance
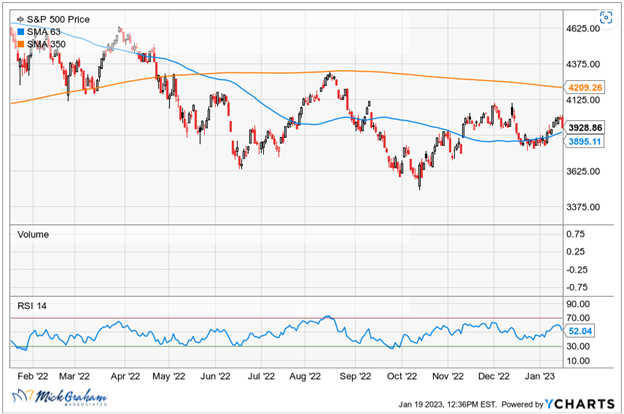
Looking at the charts might paint a better picture of where we are at and the struggles we currently face.
First, we are still putting in lower highs, we would really need to see the market go above this to signal we have based and are getting ready for a market to move up on a sustained path. It’s encouraging that we had a higher low in December, that would indicate most of the negative headwinds that are out there are or soon will be digested I believe. It will take something other than the reasons that bought us down to take us to another new low.
The 50-day moving average (the blue line) that most look at is trying to get itself back over the 200 days. (Golden Cross). This is now the 5th attempt to try and go above it, since we tipped over 12 months ago. Only time will tell this one.

Other savvy technicians look at the 9-week moving average over the 50-week moving average. I could show you in previous pullbacks how maintaining above the 9-week average has provided the platform for the next level up. We are holding it now, however, are watching closely.
Finally, I’ll give you a couple of interesting trends. Growth stocks outperformed value in yesterday’s pullback. (A very strange phenomenon), global stocks outperformed US. Is this the first sign of a trend change. I for one hope so.
Its time for me to go to work. It’s likely to be a good stock pickers market.
As always should you have any questions or concerns, please feel free to reach out.
The information contained in this report does not purport to be a complete description of the securities,
markets, or developments referred to in this material. The information has been obtained from sources
considered to be reliable, but we do not guarantee that the foregoing material is accurate or complete.
Any opinions are those of Mick Graham and not necessarily those of Raymond James. Expressions of
opinion are as of this date and are subject to change without notice. There is no guarantee that these
statements, opinions or forecasts provided herein will prove to be correct. The forgoing is not a
recommendation to buy or sell any individual security or any combination of securities. Holding stocks
for the long‐term does not insure a profitable outcome. Investing involves risk and you may incur a profit
or loss regardless of strategy selected, including asset allocation and diversification.
The S&P 500 is an unmanaged index of 500 widely held stocks that is generally considered representative of the U.S. stock market. Keep in mind that individuals cannot invest directly in any index, and index performance does not include transaction costs or other fees, which will affect actual investment performance. Individual investor’s results will vary.


